Short answer: one platform is one audience. If you advise restaurants — running a franchise group, scoring an acquisition, expanding into new metros, or just deciding whether to relocate a single shop — you need Google Maps for casual-diner volume, Yelp for foodie sentiment depth, TripAdvisor for the traveler audience, and OpenTable for verified-diner behavior. Each captures a different slice of demand and each lies in distinct ways. Combine them and a real chunk of competitive briefs end up changing verdict once the missing 60% of the picture shows up.
This is the playbook PE diligence teams and multi-location operators are quietly assembling in 2026. It doesn’t show up in vendor blogs because vendor blogs sell single-platform tools. Below is the bias map, the unified schema, the six-stage pipeline, the cost math, and the legal reality — anchored to the scrapers I’ve shipped, Google Reviews and Yelp, with the issues I actually hit building them.
Why one platform is one audience
A 12-location BBQ chain runs Google Maps competitive analysis on its 60 nearest rivals. Verdict: half a star ahead of the cluster. Plausible story, plausible recommendation, expansion plan budgeted.
Add Yelp and that half-star disappears. Yelp’s foodie audience is harsher across the board, and the chain’s signature smoked-brisket spice profile — beloved on Google — gets hammered as “too sweet” by the kind of reviewer who keeps a separate Yelp account for hot sauces. “Raise prices on the flagship” becomes “test a savory variant in three pilots before any expansion spend.”
Single-platform data wasn’t wrong. It answered a different question than the operator was asking — what do casual Google users think — and a thumbs-up there can sit on top of a thumbs-down somewhere else.
The four platforms each see a different demand population:
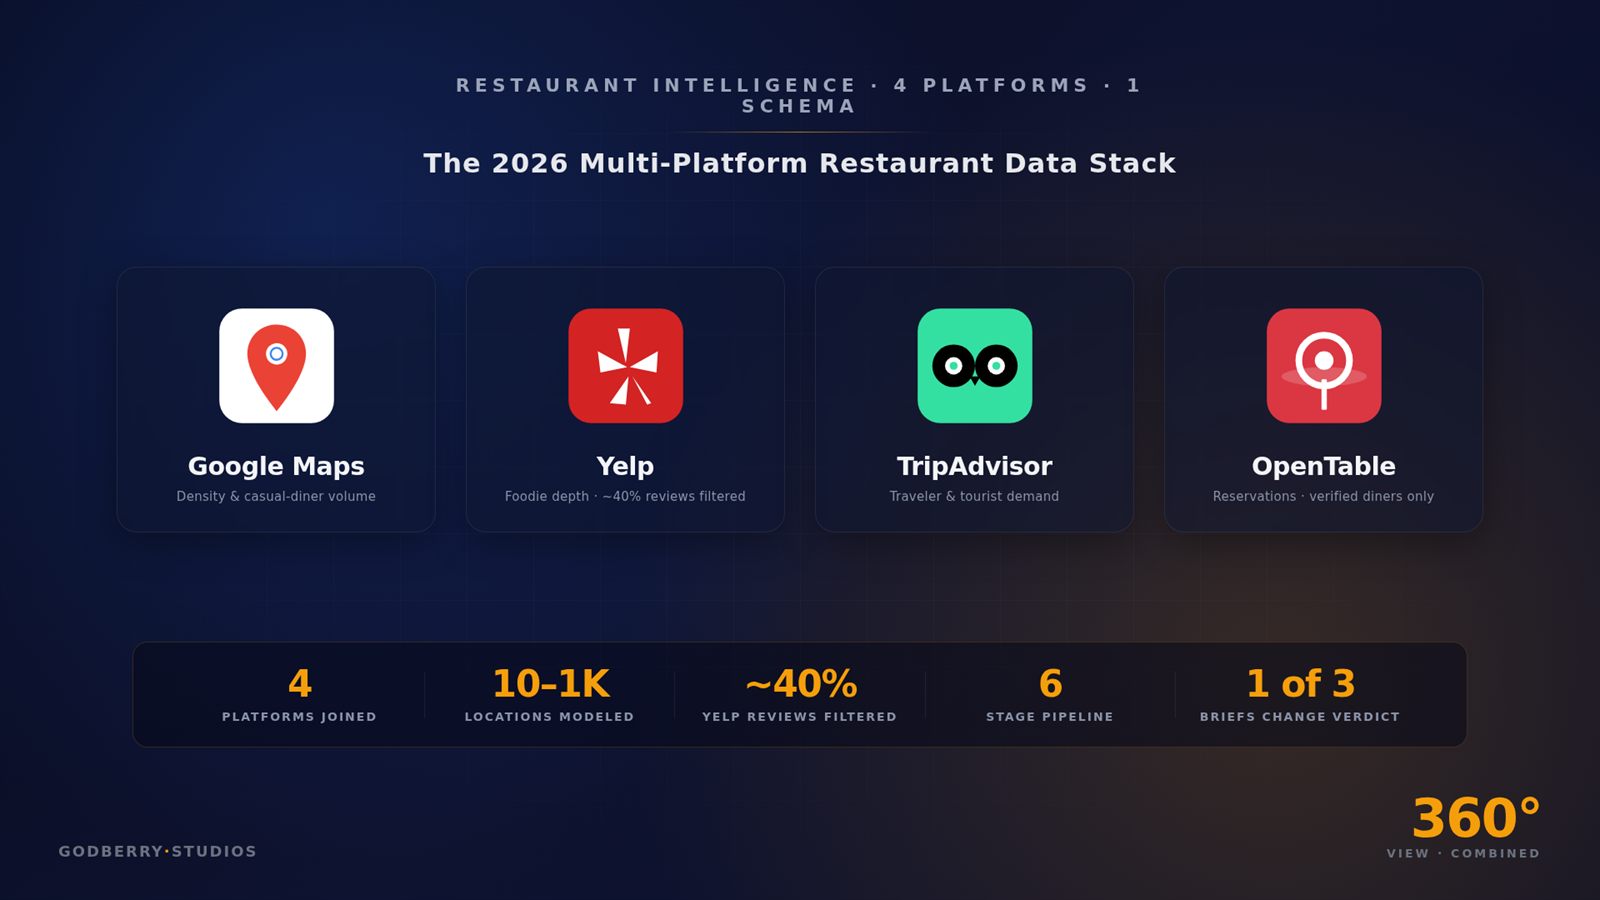
- Google Maps captures casual diners, walk-ins, locals on lunch breaks, anyone using the default Maps app. The largest review pool. The most generous star distribution. The closest thing to a representative cross-section of paying customers in a metro.
- Yelp captures the foodie segment with all the editorial weight that brings — long reviews, photo-heavy entries, regulars who track every menu change. Yelp also runs the most aggressive review-filtering algorithm on the consumer web. Roughly 25–35% of submitted reviews end up on a “not currently recommended” page that doesn’t surface in the displayed average — and for some businesses far more. A big slice of what people wrote about your competitor is hiding behind a small-print link.
- TripAdvisor captures travelers and tourists. Heavy in city centers, near hotels, in tourist zones. Very thin in suburbs. If you’re scoring a steakhouse next to a convention hotel, TripAdvisor is half the truth.
- OpenTable is the only platform where every reviewer was a verified diner — the platform processes the reservation, knows the party showed up, and only then sends the review request. Sample bias is real (reservation users skew higher-income) but consistent and known, and the data is the hardest of the four to astroturf at scale.
If your decision touches a 250-location franchise expansion, a $40M acquisition, a $2–8K/month engagement modeling competitive density, or one operator deciding whether to stay or move — you need all four. The acquisition cost is real. The engineering work is real. An honest cross-platform view is one of the few competitive moats a foodservice analyst can still build in 2026.
The 4-platform bias map
Each platform tells you something the others can’t, and each lies in distinct ways. Tape this to the wall before any analysis:
| Platform | Primary signal | Audience skew | Filter / bias to correct | Volume per location |
|---|---|---|---|---|
| Google Maps | Casual-diner sentiment + density | Locals, walk-ins, lunch crowd | Generous star distribution; review velocity inflates after Google prompts | Highest — typically 5–30× the next platform |
| Yelp | Foodie depth + long-form sentiment | Foodies, repeat reviewers, urban + west-coast skew | ~25–35% of submitted reviews routed to “not recommended”; algorithm penalty for solicited reviews | Medium — concentrated in major US metros |
| TripAdvisor | Traveler / tourist demand signal | Out-of-town diners, hotel guests, business travel | Heavily skewed to tourist zones; thin in suburban areas | Medium-high in tourist zones; near-zero outside |
| OpenTable | Reservation behavior + verified visits | Reservation users (higher-income, slightly higher-spend) | Reservation-only sample; walk-in and quick-service categories invisible | Low — reservation-eligible restaurants only |
Five things from this map that immediately matter:
Yelp’s filter is not a side note. When you compute a “Yelp average” by scraping the visible page, you’ve collected the algorithm’s curated subset, not the population. Yelp’s own Trust & Safety framing calls it quality safeguarding; for analysts the effect is a structural positive bias on the visible average. Visible 4.2, true 3.8 — that gap is a real signal you won’t see in any vendor dashboard.
TripAdvisor’s location bias is geographic. A steakhouse in a downtown convention zone may have 800 TripAdvisor reviews; the same chain’s location six miles east in a residential neighborhood may have nine. That’s not a sentiment difference; it’s a demand-population difference. Don’t normalize on review count alone.
OpenTable’s sample is small but hard to fake. Every review represents a paying customer the platform tracked through a real reservation — astroturfing and Fiverr review farms have far less purchase here than on Google or Yelp. If OpenTable’s diner-rated average diverges from Google for the same restaurant, the more likely explanation is that Google has more bad-luck walk-ins and OpenTable has the regulars.
Google Maps is the volume anchor. It will be your largest pool for almost every restaurant. Use it as the denominator: “Yelp captures 8% of Google’s review volume here,” “TripAdvisor captures 22%.” Cross-location comparisons get cleaner when ratios run against Google.
Identity overlap, zero ID overlap. A reviewer writing about the same meal on Google and Yelp will look like two reviewers in your warehouse unless you do entity resolution. More on that in stage 3.
The unified data schema
Cross-platform analysis only works if every review collapses to the same row shape. A workable schema, drawing on the field set most Google Reviews scrapers expose plus the platform-specific extensions Yelp, TripAdvisor, and OpenTable need:
CREATE TABLE reviews (
  -- Identity
  review_id           TEXT PRIMARY KEY,         -- platform-prefixed: gm_<id>, yelp_<id>, ta_<id>, ot_<id>
  platform            TEXT NOT NULL,            -- 'google_maps' | 'yelp' | 'tripadvisor' | 'opentable'
  place_id_native     TEXT NOT NULL,            -- Google place_id, Yelp business_id, TA location_id, OT restaurant_id
  place_id_canonical  TEXT NOT NULL,            -- internal canonical entity id (resolution layer)

  -- Reviewer
  reviewer_id_native  TEXT,
  reviewer_name       TEXT,
  reviewer_url        TEXT,
  reviewer_review_count INT,
  reviewer_country    TEXT,                     -- when exposed (Yelp + TA expose; Google rarely)
  is_elite            BOOLEAN DEFAULT FALSE,    -- Yelp Elite, TA Top Contributor, OT VIP
  reviewer_visit_verified BOOLEAN DEFAULT FALSE, -- TRUE on OpenTable; FALSE elsewhere

  -- Review content
  rating              NUMERIC(2,1) NOT NULL,    -- normalized 1.0-5.0
  rating_food         NUMERIC(2,1),             -- OT-only; nullable elsewhere
  rating_service      NUMERIC(2,1),             -- OT-only
  rating_ambience     NUMERIC(2,1),             -- OT-only
  rating_noise        TEXT,                     -- OT-only ('quiet'|'moderate'|'loud'|'energetic')
  text_body           TEXT,
  text_language       TEXT,                     -- ISO 639-1 detected
  review_length_chars INT,
  posted_at           TIMESTAMPTZ NOT NULL,     -- absolute date, NEVER relative
  visit_at            TIMESTAMPTZ,              -- OT exposes; TA partial; GM/Yelp no

  -- Engagement
  helpful_count       INT DEFAULT 0,
  photo_count         INT DEFAULT 0,
  owner_responded     BOOLEAN DEFAULT FALSE,
  owner_response_text TEXT,
  owner_response_at   TIMESTAMPTZ,

  -- Yelp-specific filter status
  yelp_recommended    BOOLEAN,                  -- TRUE = displayed; FALSE = "not recommended"; NULL elsewhere

  -- Computed
  sentiment_score     NUMERIC(3,2),             -- -1.0 to +1.0
  is_likely_solicited BOOLEAN,                  -- timing-cluster + length heuristics

  -- Provenance
  scraped_at          TIMESTAMPTZ NOT NULL
);
Three things the schema does on purpose. The posted_at column rejects relative strings like “3 weeks ago” — every review enters with an ISO timestamp or it doesn’t enter at all. When I shipped the Yelp Scraper, the relative-date parser had to cover 15+ languages (German “vor 3 Tagen”, French “il y a 2 mois”, Italian “3 giorni fa”, and so on); a string-equality match doesn’t survive contact with multi-locale data. The place_id_canonical column is the resolution-layer key — every native ID maps to one canonical entity. And yelp_recommended tells your analyst whether the row came from the visible page or the filtered subset, which is the difference between an honest average and a curated one.
The six-stage pipeline
Stage 1 — Location-list canonicalization across four ID systems
The four platforms use four entirely different identifiers. A single restaurant becomes:
- Google Maps:
place_id(e.g.,ChIJN1t_tDeuEmsRUsoyG83frY4) - Yelp:
business_id(slug-based:katz-delicatessen-new-york) - TripAdvisor:
location_id(numeric:g60763-d425756) - OpenTable:
restaurant_id(numeric:12345)
There is no public crosswalk. You build it. The canonicalization stage takes a list of restaurant addresses and resolves each to all four IDs.
The cleanest input is a Google place_id plus the canonical address string. From there, fuzzy-match on Yelp (search by address + business name), TripAdvisor (search returns location candidates), and OpenTable (search supports postal-code + name). Persist each native ID alongside the canonical entity ID you assign internally.
For a 50-location group this is about an hour of analyst time after the matching is automated. For 250+ you wire it into a notebook with manual override on ambiguous matches (food halls, multi-tenant spaces, recent rebrands). For 1,000+ you accept a 92–95% auto-match rate and budget review time for the remainder.
Stage 2 — Per-platform extraction with rate-limit budgeting
Pull reviews from each platform on its own schedule. Google Maps and Yelp expose far more historical reviews than TripAdvisor or OpenTable, so the cost shape is asymmetric.
Three rules that hold across all four:
- Don’t pull the entire history every run. After the initial backfill, switch to incremental pulls anchored on the highest
posted_atin your warehouse. Most clients only need trailing 90–180 days for active monitoring. - Budget concurrency by platform. Google tolerates parallel pulls fine through managed actors. Yelp’s anti-bot stack is aggressive — even legitimate Fusion API users hit rate limits at modest concurrency. When I tested my Yelp actor on Apify, datacenter IPs got 403’d on yelp.com/.ca regardless of stealth config; the path through is residential proxies + per-domain concurrency caps. TripAdvisor responds well to slow polite scraping but blocks bursty patterns within a session. OpenTable is the most fragile.
- Use cloud headless browsers when self-hosted scrapers stall. Yelp and TripAdvisor in 2026 sit behind Cloudflare and Datadome layers that are not what they were in 2022. The Byparr + Scrapling open-source stack is the cheapest path; managed actors absorb the maintenance overhead at predictable per-result pricing.
For pricing across the major scraper tools, see the Apify pay-per-event migration playbook. Outscraper, Bright Data, and DataForSEO have published rate cards; Apify’s actors charge per result on most modern pricing models.
Stage 3 — Dedupe and entity resolution across platforms
This is where most internal analytics teams give up. Two problems:
Within-platform dedupe — reviewers occasionally repost the same review verbatim, or split a long review into two consecutive entries when the platform truncates. Standard near-duplicate detection (MinHash, simhash) on text_body catches both.
Cross-platform reviewer resolution — the same person writes about the same meal on Google and Yelp two days apart. To detect: hash the first 200 characters of the review text plus a coarse rounded posted_at (rounded to day) plus the canonical place_id_canonical. Collisions across platforms are likely the same human writing twice. Don’t merge the rows — flag them so cross-platform sentiment averages don’t double-count.
Place-level resolution gets a second pass here, because the data tells you when the address you keyed off was wrong. A Yelp page returning reviews about a different cuisine, or a TripAdvisor location whose photos show a different storefront, gets routed back to manual review.
Stage 4 — Normalization and sentiment scoring
Star ratings normalize trivially: Google, Yelp, TripAdvisor, and OpenTable’s composite are all 1–5. OpenTable also exposes four-axis sub-ratings (food, service, ambience, noise) you keep separately and combine into a composite using whatever weighting matches the client’s question.
Language detection runs on text_body. Sentiment scoring should be model-based — the per-review ML cost is now trivial; the expensive part is prompt design that yields stable scores across review lengths. A 2026-typical pipeline runs sentiment at three granularities: aspect-level (food / service / value / atmosphere), document-level, and a confidence column that flags reviews where the model and the star rating disagree by more than 1.5 stars. Those mismatches are often the most useful reviews to read individually.
Stage 5 — Bias-correction layer
This is the stage that moves an analysis from “scraped data” to “decision-grade signal.” Skip it and you’ll publish a wrong number with confidence.
- Yelp filter correction. Pull both the recommended and “not currently recommended” pages for every Yelp location. Compute a true Yelp average from the union, alongside the visible average from the recommended subset. Track the gap as its own metric — a 4.5/3.9 split is interesting in its own right.
- TripAdvisor traveler skew. Compute a “TripAdvisor density score” = TA reviews / Google reviews per location. Segment into bands (high tourist density: TA/GM > 0.4; medium: 0.1–0.4; low: < 0.1) before drawing comparative conclusions.
- OpenTable sample weighting. Reservation-eligible reviews represent a higher-spend audience than the general population. When using OT to predict Google or Yelp trajectory, regress OT against historical paired data first; don’t pretend the populations are interchangeable.
These corrections add half a day on initial build and zero on subsequent runs.
Stage 6 — Comparative dashboards
The output the buyer actually pays for. The minimum viable dashboard answers six questions per location set:
- Visible average vs. true average vs. peer-set average per platform
- Review velocity trajectory by platform, last 90 / 180 / 365 days
- Aspect-level sentiment radar (food / service / value / atmosphere)
- Which audience segment is happiest at each location
- Where one platform diverges sharply from the others (the “blind-spot” view)
- Owner-response cadence per location per platform vs. peer set
For PE diligence, swap items 5–6 for a “what would change if the acquisition happens” simulation — sentiment forecast under the buyer’s existing operating playbook, applied to the target’s review trajectory.
Five questions cross-platform data answers that single-platform can’t
The value isn’t in any one feed. It’s in the questions you can only ask once they’re side by side:
1. What’s the real review volume vs. the platform-filtered volume? Visible Yelp 4.2; unfiltered 3.8. A single-platform analysis would never show that 9% gap.
2. How does sentiment disperse across audience segments? Google says casual diners love it (4.4); Yelp says foodies are mixed (3.6); TripAdvisor says travelers love it (4.5); OpenTable says reservation regulars love it (4.6). Verdict: strong on casual + traveler + regular; underwhelming on foodie. If your client is opening in Brooklyn, that mix matters.
3. How frequently do specific menu items get mentioned per audience? “Burrata” appears in 18% of Yelp reviews vs. 4% of Google reviews — Yelp users notice the appetizer; Google users notice the burgers. The menu-engineering recommendation depends on which audience you’re optimizing for.
4. Where’s the price-perception gap between casual and tourist diners? TripAdvisor tourists often rate “value” 0.5–1.0 stars below local Google reviewers at the same restaurant. The magnitude is the operating signal. Tourist-zone restaurants can sustain higher-priced positioning; suburban locations of the same brand can’t.
5. How does owner-response cadence compare across platforms? Most operators reply on Google and ignore everything else. Showing a client that their competitor responds to 78% of TripAdvisor reviews vs. their 12% is the kind of finding that closes a $5K/month engagement. The Google Reviews playbook covers the single-platform benchmarks; the cross-platform version is where the moat sits.
Cost-per-location math at four scale points
Costs include data acquisition and platform pass-through; not analyst time. Assumes ~200 reviews/location averaged across the four platforms (Google heavy, OT light), refreshed quarterly:
| Locations | Reviews/quarter | DIY scraping stack | Apify-style managed actors | SaaS reputation platform |
|---|---|---|---|---|
| 10 | ~8K | $40–90/mo (proxies + cloud browser) + dev time | $20–60/mo per-result | $300–800/mo |
| 50 | ~40K | $150–300/mo + dev time | $90–260/mo | $1.5K–3.5K/mo |
| 250 | ~200K | $400–1K/mo + dedicated dev | $400–1.1K/mo | $6K–15K/mo |
| 1,000 | ~800K | $1.2K–3K/mo + dev team | $1.5K–4K/mo | $20K–60K/mo |
The interesting band is 50–250 locations. Below 50, SaaS reputation tools (Birdeye, Podium, Reputation.com, NiceJob) win on simplicity even though per-location cost is high — the operator gets a working product instead of an engineering project. The AI Local SEO Stack comparison walks through SMB-tier trade-offs. Above 250, SaaS either prices out entirely or only solves listing-and-response, leaving the analytical layer to be built. In the 50–250 band managed scrapers consistently come in cheapest, because the DIY engineering investment rarely pays back inside two years.
For agencies adding multi-platform intelligence as a service line at $2–8K/month per client, the 50–250 band is also where gross margin is healthiest: per-result data costs scale linearly, analytical work amortizes across clients, and the dashboard is a one-time build.
Build vs. buy: three honest paths
Build the stack yourself. Best for teams with a full-time data engineer, recurring use across clients, and a reason to control the pipeline (custom analysis, regulatory data residency, IP you want to own). First version: 4–8 weeks. Maintenance: ~10% of an engineer’s time after that, mostly platform-selector changes — Yelp and TripAdvisor both reshuffle their review markup periodically, so budget for selector breakage a couple of times a year. The Web Scraping for Beginners guide covers the foundational tooling; the four-platform layer is mostly stitching together what you already build for one.
Buy managed actors. Best for analyst-led teams without a dedicated engineer. Apify-style actors (Compass, memo23, Outscraper, Bright Data, DataForSEO, and a growing set of per-platform actors on the Apify Store) absorb the selector maintenance. You pay per result and get a stable JSON shape. The trade-off is per-actor pricing surprises at high volume — model it carefully at 250+ locations.
Buy a SaaS reputation platform. Best for operators (not agencies) who need a working product instead of an analytical layer. The big platforms now bundle Google + Yelp + Facebook reviews; few cover TripAdvisor and almost none cover OpenTable. If you only need 10–50 locations, SaaS is the right answer. If your work requires correlated cross-platform analysis, you’ll outgrow the SaaS tier within 18 months.
A middle path more agencies are landing on in 2026: SaaS for listing management and response automation; managed scrapers for the analytical layer; a small in-house dashboard joining them. The agency keeps the analytical IP; operator clients see a working product on the listing side.
Legal and ToS reality check, 2026
The honest version, not the fearmongering one.
Yelp Fusion API. Free, but the daily cap depends on when your API client was created: clients made before 16 May 2023 keep the old 5,000 calls/day; anything registered after is capped at 500/day. And the API returns only three ~160-character review excerpts per business, not full text — and never has. For full-review analysis the API is not the answer. Scraping carries the standard ToS-violation posture; U.S. precedent since hiQ Labs v. LinkedIn gives publicly-available data scraping reasonable cover on the CFAA question — though hiQ itself ultimately lost on a breach-of-contract claim, so the ToS exposure is real even where CFAA exposure isn’t. The platform may also rate-limit or block. EU operators apply GDPR rules to reviewer-identity columns.
Google Place Details API. Returns up to five reviews per place. Hard ceiling. For more than five — i.e., any analysis that matters — you scrape, use a managed actor, or license a vendor feed. Since the March 2025 pricing overhaul, cost is tiered by which fields you request: roughly $17 per 1,000 at the Pro tier (after a 5,000-call free monthly cap), dropping with volume.
TripAdvisor Content API. Free for partners, attribution-required, restricted to explicit partnership agreements. Most analytical use cases don’t qualify.
OpenTable. No public reviews API at any tier. Scraping is the only path; the small dataset size means the platform notices high-volume pulls quickly. Polite, slow, location-by-location holds up; bulk parallel pulls don’t.
GDPR for EU-located restaurants. Reviews are public personal-data publications under GDPR. Reviewer name and avatar are identifying. The conservative posture: don’t store reviewer-personal columns longer than the analytical need; offer a deletion-on-request channel; document the legal basis (legitimate interest, balanced against the reviewer’s reasonable expectation of public visibility). The Yelp Scraper I shipped defaults the GDPR-aware fields off on EU-regional domains; the warehouse side gets a separate purgeAfterDays retention column.
What I’d avoid
- Averaging ratings across platforms. A “blended 4.3” hides the audience-segment dispersion that’s the entire point of pulling four platforms.
- Ignoring the Yelp filter. If your dashboard reads off the visible page only, label it “visible Yelp average (filter-curated)” — your clients deserve to know which number they’re looking at.
- Pretending OpenTable’s sample is representative. It isn’t. It’s accurate within its sample, and that sample is reservation users.
- Shipping without ISO dates. “3 weeks ago” is not a date. Force every row through an absolute-date parser. Multi-locale support is non-optional if any client touches non-US markets.
- Bulk-pulling TripAdvisor and OpenTable at the concurrency you’d use for Google Maps. You’ll burn the IP block, the account, or both.
- Assuming Google Maps reviews are stable across UI versions. Google has shipped multiple “limited view” experiments in 2026 that change which reviews are returned to a logged-out scraper — the Google Maps Limited View notes cover what changed and what still works.
The biggest mistake in restaurant intelligence is treating one platform’s number as the answer when it’s just one of four answers from different audiences. Most vendor dashboards are built for that mistake because building for it is cheaper than building for the truth. The four-platform stack costs money, the bias-correction layer is the part nobody wants to build, and the per-platform maintenance outlives any individual analyst’s enthusiasm for it — but the people paying ($5K/month agency clients, PE diligence funds, franchise expansion teams) pay because the four-platform answer is the one that survives contact with the actual market.
If you’re already running single-platform analysis for clients, the upgrade path is mechanical: add one platform this quarter, build its bias-correction layer, add the next next quarter. Six to nine months from now you have something the SaaS tier can’t sell, and per-client retention math gets noticeably better.